Minqi Li
University of Utah
minqi.li@economics.utah.edu
Abstract
This paper evaluates the implications of global emissions budget distribution between three large geographical areas (China, OECD countries, and the rest of the world) in the context of Anthropocene and the structural crisis of the capitalist world system. Two plausible emissions distribution principles are considered. Under neither the inertia principle nor the equity principle, can continuing economic growth be made compatible with requirements of climate stabilization in all three regions. This conclusion does not change significantly when plausible acceleration of emissions intensity reduction in the future is taken into account. To limit global warming to not more than 2 degrees Celsius by the end of this century, at least two of the three large regions need to reorganize their economies to operate with zero or negative growth. Such a reorganization cannot be achieved under a capitalist economic system given the inherent tendency of capitalism towards endless accumulation. Neither is it likely to be achieved under any conceivable economic system dominated by market relations.
Keywords: Anthropocene, Emissions budget, Capitalism, Structural crisis, De-growth
ISSN: 1076-156X | Vol. 26 Issue 2 | DOI 10.5195/JWSR.2020.977 | jwsr.pitt.edu
Journal of World-System Research | Vol. 26 Issue 2 | Li 289
The Anthropocene refers to the Earth’s most recent geologic period in which geochemical, biological, atmospheric, and other earth system processes have been transformed by significant human impact (Waters et al. 2016). Although significant human impact began about eight thousand years ago when agricultural civilizations emerged, massive and fundamentally unsustainable human impact has taken place only during the modern capitalist era. The capitalist world system is based on the pursuit of endless accumulation of capital. Statistically, this is reflected by economic growth at exponential rates. Modern economic growth has been based on the massive consumption of fossil fuels, which lead to the emissions of greenhouse gases as well as anthropogenic climate change which is threatening the human civilization with existential risks.
To prevent catastrophic consequences, it is necessary to limit global warming to not more than 2 degrees Celsius relative to the pre-industrial time. A global emissions budget (allowance for future carbon dioxide emissions) can be defined based on the historical relationship between cumulative carbon dioxide emissions and observed global average surface temperatures. However, the required decline of emissions may not be compatible with continuing growth of the global economy during the rest of the 21st century, which is a necessary condition for the stability of the capitalist world system.
Moreover, interstate competition is a necessary political condition for the operation of the capitalist world system. For global emissions reduction to take place, it is necessary to divide up the global emissions budget between the competing national states. This paper considers two plausible emissions distribution principles: inertia and equity. Under the inertia principle, each country is entitled to a share of the global emissions budget that equals its current share in global emissions. Under the equity principle, each county is entitled to a share of the global emissions budget that equals its current share in global population. The entire world is divided into three large geographic areas: China, OECD (countries in the Organisation for Economic Co-operation and Development), and the rest of the world. This paper will demonstrate that neither the inertia principle nor the equity principle can be made compatible with continuing economic growth in all three regions.
The next section briefly summarizes the arguments that Anthropocene has arrived as a new geological era and discusses the potentially catastrophic consequences of the anthropogenic climate change. The third section discusses the capitalist world system and the geographical pattern of carbon dioxide emissions. The fourth section argues that it is no longer possible to limit global warming to not more than 1.5 degrees Celsius by the end of this century and it would be a reasonably ambitious objective to limit global warming to not more than 2 degrees Celsius. The section then establishes a global emissions budget associated with the two-degree objective. The fifth section considers three large regions of the world (China, OECD, and the rest of the world) and evaluates the implications of emissions budgets under the inertia principle and the equity principle for the three regions. Neither the inertia principle nor the equity principle can be made compatible with continuing economic growth in all three regions. The sixth section considers the possibility for accelerated technological progress to achieve climate stabilization without sacrificing economic growth. Despite optimistic assumptions about future potentials of emissions intensity decline, emissions budgets consistent with less than two-degree global warming remain incompatible with continuing economic growth in some regions. The seventh section discusses strategies for climate stabilization in the context of the structural crisis of the capitalist world system. It argues that “de-growth” is a necessary condition for both climate stabilization and ecological sustainability. Neither capitalism nor market socialism is likely to deliver zero or negative economic growth required for climate stabilization.
Anthropocene and the Impending Climate Catastrophe
A growing number of geologists are currently proposing that the earth system has entered into a new geological epoch that should be named as “Anthropocene” in which the humans are altering the long-term global geologic processes at increasing rate. While some propose an “early Anthropocene” that began with the spread of agriculture and deforestation, others recognize that the most dramatic change has taken place since the beginning of the Industrial Revolution around 1800. Modern industry has created and disseminated globally novel materials such as aluminum, concrete, and plastics. Residues from various chemical products have changed the geochemical signatures in sediments and ice. Soil nitrogen and phosphorus inventories have doubled in the past century. About 50 percent of the earth’s land\ surface has been transformed for human use. Biological extinction rates since 1500 have been far above the background per-million-year extinction rates. Global sea level is now rising at a rate of about 3 millimeters per year and is already higher than at any point during the past 115,000 years. The combination of these developments suggests that humans have already changed the earth system sufficiently to produce a stratigraphic signature that is distinct from the Holocene epoch (the last geological epoch that began about 11,700 years ago) (Waters et al. 2016). In May 2019, the Anthropocene Working Group of the International Commission on Stratigraphy under the International Union of Geological Sciences voted to make a formal proposal to the International Commission on Stratigraphy that Anthropocene should be treated as a formal chrono-stratigraphic unit (SQS 2019).
Among the various anthropogenic changes (environmental changes caused by human activity) that have taken place over the past two hundred years, anthropogenic climate change is one of the most important in the sense that uncontrolled climate change poses existential risks to human civilization. While this paper focuses on climate change and its implications for global emissions budget and the capitalist world system, I fully recognize that anthropogenic climate change is only one aspect of various interacting physical, chemical, biological, and human processes currently taking place in our planet. Climate change is only one dimension of the multi dimensional challenges brought about by the Anthropocene and success in climate stabilization by itself does not automatically lead to successful management of other environmental damages caused by anthropogenic geochemical changes (Thomas 2019).
Modern economic growth has been based on the massive consumption of fossil fuels (coal, oil, natural gas). The combustion of fossil fuels and other industrial processes result in emissions of greenhouse gases (such as carbon dioxide, methane, nitrous oxide, and various minor gases). Carbon dioxide is the most important greenhouse gas, currently accounting for about 66 percent of the global radiative forcing from all greenhouse gases (NOAA 2019a).
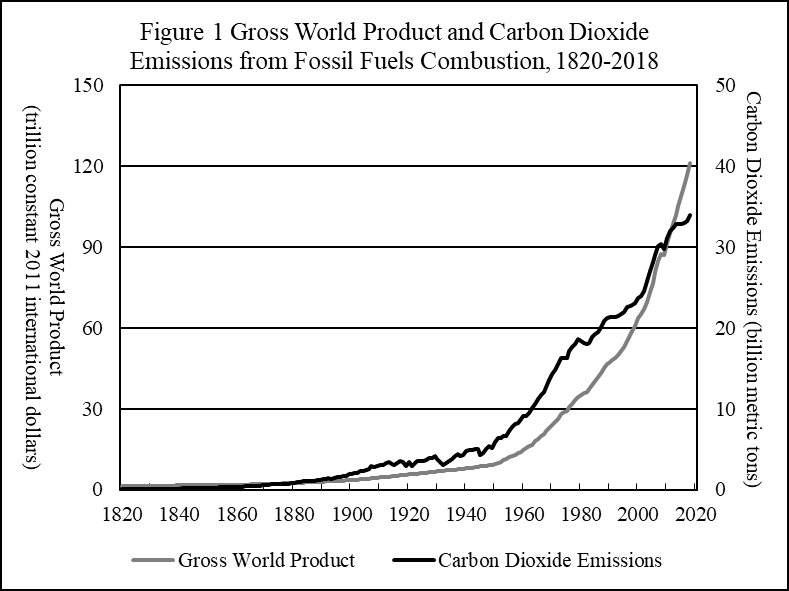
Sources: Gross world product from 1990 to 2018 in constant 2011 international dollars is from World Bank (2019), linked to world GDP in constant 1990 international dollars from 1820 to 1990 from Maddison (2010). World carbon dioxide emissions from fossil fuels combustion from 1820 to 1964 is from Boden, Marland, and Andres (2017). World carbon dioxide emissions from fossil fuels combustion from 1965 to 2018 is from BP (2019).
Historically, world economic growth has been closely correlated with carbon dioxide \ emissions. From 1870 to 2018, gross world product grew from 1.9 trillion dollars to 121 trillion dollars or by 62.4 times; during the same period, world carbon dioxide emissions grew from about 540 million metric tons to 33.9 billion metric tons or by 62.9 times. Although emissions growth has slowed in recent years, the emission levels are now far above what are absorbed by oceans and terrestrial ecological systems and about one-half of the annual emissions ends up in the atmosphere (Hansen 2019, Figure 16).
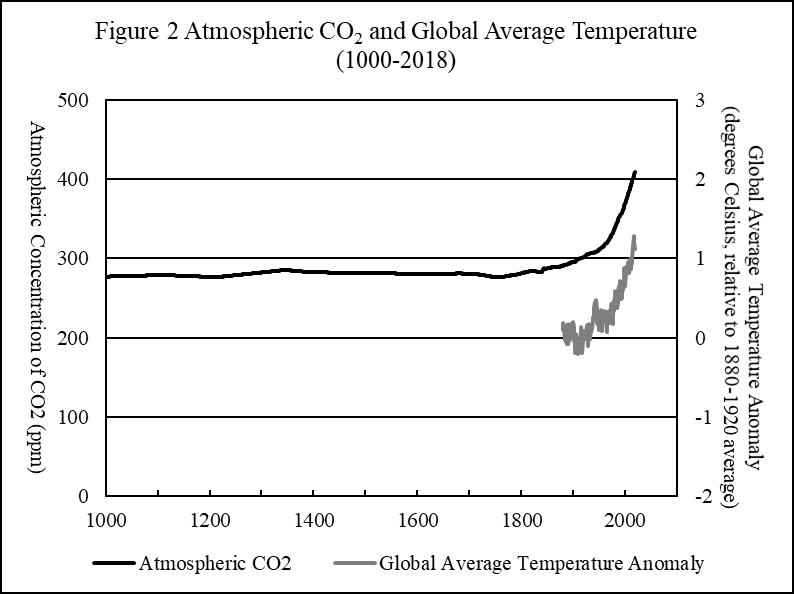
Sources: Atmospheric concentration of carbon dioxide from AD 1000 to 1958 is from EPI (2015). Atmospheric concentration of carbon dioxide from 1959 to 2018 is from NOAA (2019b). Global average temperature anomaly from 1880 to 2018 is from NASA (2019).
In the late Holocene period, atmospheric concentration of carbon dioxide was very stable. It stayed around 280 parts per million (ppm) until the early 19th century. Since then, atmospheric carbon dioxide has grown at accelerating rates. In recent years, atmospheric carbon dioxide has grown at an average annual rate of 2.3 ppm. It reached 409 ppm in 2018. If this growth rate is continued, atmospheric concentration of carbon dioxide will exceed 450 ppm in 18 years and exceed 550 ppm in 61 years. In the modern period, global average temperature has followed closely the growth of atmospheric concentration of carbon dioxide. In 2016, global average temperature reached 1.28 degrees Celsius higher than the 1880-1920 average. This is the highest global average temperature in the modern record. For the period 2009-2018, ten-year average global temperature was 1.04 degrees Celsius higher than the 1880-1920 average.
If global warming rises to more than 2 degrees Celsius relative to the pre-industrial time, West Antarctica ice sheets may disintegrate causing sea level to rise by 5-9 meters over the next 50-200 years. Bangladesh, European lowlands, the U.S. eastern coast, North China plains, and many coastal cities will be submerged (Hansen et al. 2016). If global warming rises to more than 3 degrees Celsius relative to the pre-industrial time, global sea level may rise by 25 meters and world food supplies would be critically endangered; rising sea level, famine, and drought could turn billions into environmental refugees. Moreover, global warming by more than three degrees may lead to uncontrolled climate feedbacks leading to runaway global warming. For example, Amazon rainforest may degenerate into savanna releasing massive amounts of carbon dioxide which alone could generate 1.5 degrees Celsius of additional warming (Spratt and Sutton 2008: 29-31). Hansen (2007: 140-171) argued that, through various long-term climate feedbacks, a doubling of atmospheric carbon dioxide (a doubling of atmospheric concentration of carbon dioxide from the pre-industrial level would approximately be 550 ppm) would eventually lead to global warming by 6 degrees Celsius and a world nearly free of ice sheets with sea level 75 meters higher than today.
A human body cannot survive in an environment with “wet-bulb temperature” (the temperature with 100 percent humidity) at 35 degrees Celsius or above for more than a few hours without suffering from metabolic failure (Sherwood and Huber 2010). For people who have to do outside work exposed to the sun, the practical tolerance limit is likely to be significantly lower. Currently about 60 percent of the world population lives in areas where the annual maximum wet-bulb temperature is 26 degrees Celsius or above and the highest instantaneous wet-bulb temperature anywhere on earth is about 30 degrees Celsius. Global warming by more than 6 degrees Celsius would turn a part of the earth surface literally unsuitable for human inhabitation and impose hitherto unknown heat stress to more than one half of the world population. To understand how the world has arrived at such a turning point where the very survival of human civilization is at stake, it is necessary to examine the socio-economic system in which we live – the system of capitalism.
The Capitalist World System and Carbon Dioxide Emissions
Sustained and exponential economic growth is a distinct feature of the modern capitalist system. While all class societies have been based on the appropriation of the surplus product by a ruling class that accounts for a small fraction of the total population, capitalism is unique in its tendency to use a relatively large portion of the surplus product for accumulation of capital or the expansion of the society’s material production capacity. The regular reinvestment of a large portion of the surplus product for accumulation has led to exponential growth of material production and consumption, statistically reflected by economic growth.
Immanuel Wallerstein defined capitalism as the historical system driven by the pursuit of “endless accumulation of capital” (Wallerstein 2007: 24). The necessary political condition for “endless accumulation of capital” is a world system that consists of multiple political structures (rather than dominated by a single political structure). Interstate competition forces the “national states” to compete for the mobile capital controlled by the capitalists and provides motivation for the states to undertake and promote capitalist accumulation (Arrighi, Hui, Hung, and Selden 2003: 266-268; 276-281).
Moreover, within each capitalist state, allocation of productive resources is dominated by market relations. Market competition forces each capitalist to use a large portion of the surplus value to accumulate capital and pursue “expanded reproduction.” Those capitalists that fail to accumulate capital and expand production successfully may become bankrupt and cease to function as capitalists (Marx [1867] 1967: 554-561). According to the world system theoretical framework, states within the capitalist world system are divided into three structural layers: the core, the semi-periphery, and the periphery. While the core states specialize in monopolistic, high-profit activities; the peripheral states specialize in highly competitive, low-profit activities. Semi-periphery plays an indispensable role in the system by serving as the politically stabilizing “middle stratum” and the preferred location to receive obsolete industries relocated from the core during times of crisis (Wallerstein 1979: 18-23; 69-71). However, there has not been a set of uniformly accepted empirical definitions of the three structural layers. The various country groups defined by mainstream international organizations (such as the World Bank) either fail to match the three structural layers conceptualized by the world system approach or, at best, can provide no more than an imperfect proxy.
Empirical studies on geographical patterns of environmental impact often use various measures that divide the capitalist world system into different groups of “developed” and “less developed” countries. For example, in their study on whether there has been “decoupling” between economic growth and environmental impact, Jorgensen and Clark (2012) defined “developed countries” as those in the upper quartile of the World Bank’s income classification of nations. In a study on the relationship between renewable energy consumption and economic growth, Thombs (2017) divided the countries in the world into four groups: high income, upper-middle income, lower-middle income, and low income.
This paper is mainly concerned with the relationship between the capitalist world system and carbon dioxide emissions. What is clear is that the more “developed” capitalist countries have been responsible for most of the historical carbon dioxide emissions. From 1751 to 2018, the United States, Germany, the United Kingdom, and Japan accounted for 24.8 percent, 5.6 percent, 4.8 percent, and 3.9 percent of the world’s total cumulative emissions respectively. In addition, “Rest of Europe” (excluding Russia) accounted for 16.2 percent, and Canada and Australia accounted for 3 percent. Therefore, total historical emissions by the developed capitalist countries accounted for about 58 percent of the cumulative carbon dioxide emissions that have taken place since the Industrial Revolution (Hansen 2019, Figure 27). In mainstream economic studies, developed capitalist countries are often represented by the OECD (Organisation for Economic Co-operation and Development) described as a “club of rich countries” (Buttonwood 2017; Davis 2016; Noble 2019). OECD includes all “high-income economies” defined by the World Bank except high-income small islands, a few city states, and high-income oil exporters (OECD 2020; World Bank 2020). Using OECD countries in empirical studies has the benefit that the definition of this country group is consistent across different economic and energy statistical reports. In recent years, carbon dioxide emissions from the OECD countries have declined but continue to account for a large part of the world’s total emissions. In 2018, OECD countries accounted for 36.6 percent of the world’s total carbon dioxide emissions from fossil fuels consumption (BP 2019).
On the other hand, in recent years, China has emerged as the world’s largest carbon dioxide emitter. In 2018, China alone accounted for 27.8 percent of the world’s total carbon dioxide emissions from fossil fuels consumption (BP 2019). Thus, China and the OECD countries together now account for about 64 percent of the world’s total emissions. It is obvious that any global effort towards climate stabilization cannot succeed without active and serious participation by both China and the OECD countries.
Global Emissions Budget
According to the Fifth Assessment Report by the United Nations’ Intergovernmental Panel on Climate Change, cumulative total emissions of carbon dioxide and global mean surface temperature have been approximately linearly related and future global warming will be largely determined by the range of cumulative carbon dioxide emissions (IPCC 2013: 27).
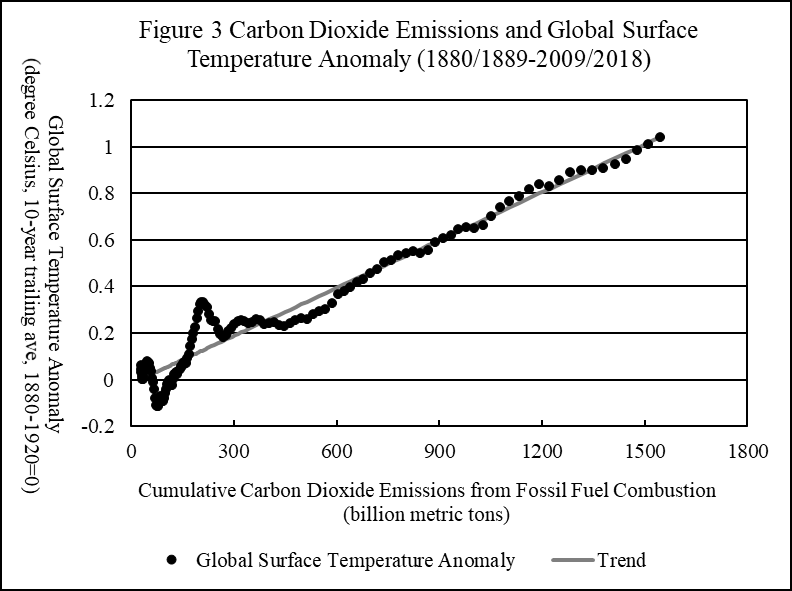
Sources: World carbon dioxide emissions from fossil fuels combustion from 1750 to 1964 is from Boden, Marland, and Andres (2017). World carbon dioxide emissions from fossil fuels combustion from 1965 to 2018 is from BP (2019). Global average temperature anomaly from 1880 to 2018 is from NASA (2019). In Figure 3, the linear trend fits the historical observations very well (regression R-square is 0.94). The linear trend implies that for each increase in cumulative carbon dioxide emissions by one trillion metric tons, global average temperature tends to rise by 0.68 degrees Celsius.
Global average temperature over the period 2009-2018 is 1.04 degrees Celsius higher than the pre-industrial time. If the global objective is to limit global warming by the end of the 21st century to not more than 3 degrees Celsius, the additional warming that can be allowed for between 2018 and 2100 would be 1.96 degrees Celsius and the implied global emissions budget (allowance for future carbon dioxide emissions) during 2019-2100 would be 2.88 trillion metric tons (based on the statistical relationship shown in Figure 3, 1.96/0.68 = 2.88). However, global warming by more than 3 degrees Celsius will lead to global sea level rise by 25 meters over the coming centuries and it carries the substantial risk of runaway global warming which will probably bring the civilization as we know it to an end.
According to the Paris Climate Agreement signed by 195 United Nations member countries in December 2015, the signatory countries officially undertook to keep “a global temperature rise this century well below 2 degrees Celsius above pre-industrial levels and to pursue efforts to limit the temperature increase even further to 1.5 degrees Celsius” (UNFCCC 2019). If the world would actually be committed to the objective to limit global warming by the end of this century to not more than 1.5 degrees Celsius, the additional warming that can be allowed for between 2018 and 2100 would be only 0.46 degrees Celsius and the remaining global emissions budget during 2019-2100 would be about 680 billion metric tons. The global carbon dioxide emissions in 2018 were about 34 billion metric tons. Therefore, the remaining global emissions budget required for 1.5 degrees warming would be completely used up in twenty years if the world were to keep generating emissions at the same rate as in 2018. For all practical purposes, it is no longer realistic to expect global warming to be limited to not more than 1.5 degrees Celsius. In fact, despite the grand objective announced by the Paris Climate Agreement, the combination of the national “pledges and targets” regarding their intended emissions reduction is currently consistent with global warming by 2.9 degrees Celsius by the end of this century (Climate Action Tracker 2019).
This paper assumes that a reasonably ambitious objective is to limit global warming by the end of this century to not more than 2 degrees Celsius relative to the pre-industrial time. Such an objective will not be able to prevent all aspects of dangerous climate change (for example, global sea level will rise by at least several meters if global warming reaches two degrees). Moreover, such an objective does not rule out the possibility of further global warming in the 22nd century and beyond. Global warming by two degrees by the end of this century roughly corresponds to the upper range of the scenario of RCP 2.6 (RCP stands for “representative concentrated pathways”) (IPCC 2014: 13). Such a scenario implies atmospheric concentration of carbon dioxide equivalent (including carbon dioxide and other greenhouse gases) rising to 550 ppm by 2100. This would represent a doubling of atmospheric greenhouse gases compared to the pre-industrial level and if this level is sustained, the long-term global warming over the course of coming centuries and millennia will be at least 3 degrees Celsius and could rise to 6 degrees or more when various long-term climate feedbacks are taken into account (Hansen 2007: 140-171).
Nevertheless, the two-degree objective is “reasonable” in the sense that it will at least substantially reduce the risk of runaway global warming in the next one or two centuries and, as a result, buy the humanity the necessary time to adapt and develop new technologies to reverse global warming in the coming centuries (perhaps through a global effort to extract and store carbon dioxide from the atmosphere on a massive scale). On the other hand, the objective would still be “ambitious” in the sense that, most likely, it cannot be accomplished under the existing capitalist world system.
If the global objective is to limit global warming by the end of this century to not more than 2 degrees Celsius, the additional warming that can be allowed for between 2018 and 2100 would be 0.96 degrees Celsius. Based on the statistical relationship shown in Figure 3 and described above (for each increase in cumulative carbon dioxide emissions by one trillion metric tons, global average temperature tends to rise by 0.68 degrees Celsius), the remaining global emissions budget during 2019-2100 would be about 1.41 trillion metric tons (0.96/0.68 = 1.41). This is the global emissions budget I will use for the rest of the paper. As is explained above, global warming by two degrees roughly corresponds to the upper range of the IPCC scenario of RCP 2.6 (IPCC 2014: 13). According to IPCC (2013: 27), the cumulative carbon dioxide emissions from 2012 to 2100 consistent with the various pathways under RCP 2.6 range from 510 billion metric tons to 1.5 trillion metric tons. Therefore, the global emissions budget used in this paper is consistent with the upper end of the cumulative emissions allowed for under the IPCC scenario of RCP 2.6. Compared to the IPCC scenario, the global emissions budget used in this paper is based on updated data and is calculated using carbon dioxide emissions from fossil fuels consumption only. Data for carbon dioxide emissions from fossil fuels consumption are considered to be the most reliable among all types of greenhouse gas emissions data (Hansen 2007: 118-120).
The future global carbon dioxide emissions pathway can be derived from the global emissions budget. If the global carbon dioxide emissions were to begin declining in 2019 and decline at a uniform annual rate between 2019 and 2100, global emissions need to decline by 1.85 percent each year in order to stay within the global emissions budget of 1.41 trillion metric tons. Any delay in the beginning of emissions decline would make the required decline rates higher for later years. The emissions intensity of GDP is defined as the ratio of carbon dioxide emissions over real gross domestic product (GDP in constant prices or corrected for inflation). Therefore, real GDP equals carbon dioxide emissions divided by emissions intensity of GDP:
Real GDP = Carbon Dioxide Emissions / Emissions Intensity of GDP (1)
The above formula, in growth rate format, can be approximated as:
Economic Growth Rate (real GDP growth rate) ≈ Emissions Growth Rate – Emissions Intensity of GDP Growth Rate (2)
Since the decline rate of emissions intensity of GDP is negative growth rate of emissions intensity of GDP, therefore approximate equation (2) can be re-written as:
Economic Growth Rate ≈ Emissions Growth Rate + Emissions Intensity of GDP Decline Rate (3)
Similarly, as the decline rate of carbon dioxide emissions is negative growth rate of emissions, approximate equation (3) can also be written as:
Economic Growth Rate ≈ Emissions Intensity of GDP Decline Rate – Emissions Decline Rate (4)
From 1990 to 2018, world GDP grew at an average annual rate of 3.4 percent and world carbon dioxide emissions grew at an average annual rate of 1.67 percent. The global economy’s average emissions intensity of GDP thus fell at an average annual rate of 1.67 percent from 1990 to 2018 (note that, mathematically, the sum of the growth rate of carbon dioxide emissions and the decline rate of emissions intensity of GDP is only approximately equal to the economic growth rate; the precise mathematical calculation is not elaborated here for simplicity). Data for world GDP and carbon dioxide emissions are from World Bank (2019) and BP (2019) respectively (world GDP is measured by constant 2011 international dollars).
Therefore, if the global economy’s average emissions intensity continues to decline according to its historical trend (with a decline rate of 1.67 percent) and the world carbon dioxide emissions were to decline by 1.85 percent each year (required by the global emissions budget consistent with global warming by less than two degrees), world economy will have to contract by 0.18 percent each year (see the approximate equation 4 above). As the world population is still growing at about 1.1 percent a year, a decline of world economy by near 0.2 percent a year would translate into a decline of world average per capita GDP by near 1.3 percent each year. Historically, global capitalist economy has needed a certain level of economic growth rate to remain economically and politically stable. During 1913-1950, a historical period that included two world wars and the Great Depression, the world economy as a whole actually managed to grow at an average annual rate of 1.8 percent (Maddison 2010). Since 1950, global economic growth rate has rarely fallen below 2 percent. It is difficult to imagine that the capitalist world system can remain stable if the world average per capita GDP is in constant decline. Moreover, in a world system based on interstate competition, there is not a world government to implement and enforce the global emissions budget. Instead, the global emissions budget has to be divided between and implemented by individual national states.
China, OECD, and the Rest of the World
The capitalist world system includes about two hundred independent national states. In principle, it is possible to conduct a detailed study to evaluate the implications of different emissions budgets for each individual country. However, this paper is mainly interested in demonstrating the political difficulties for reasonable climate stabilization to be achieved within the capitalist world system. For this purpose, it is sufficient to divide the entire world into several large geographical areas and consider the implications of different emissions budgets for economic growth in each of the large regions. In this section, three large geographical areas are considered: China, OECD countries, and the rest of the world. Data for population and GDP for the three large regions are from World Bank (2019). Data for carbon dioxide emissions for the three large regions are from BP (2019). Both the World Bank data and the BP data cover the entire world. China refers to mainland China. OECD countries include all member countries of the Organisation for Economic Co-operation and Development. The rest of the world’s population is derived by subtracting China’s and the OECD’s population from the world population. Similarly, the rest of the world’s GDP is derived by subtracting China’s and the OECD’s GDP from the world GDP and the rest of the world’s carbon dioxide emissions are derived by subtracting China’s and OECD’s emissions from the world total emissions.
China is currently the world’s largest economy (measured by purchasing power parity) and the largest carbon dioxide emitter, deserving to be considered by itself. In 2018, China alone accounted for 18.3 percent of the world population and 27.8 percent of the world carbon dioxide emissions. The OECD countries includes all “high-income economies” defined by the World Bank except high-income small islands, a few city states, and high-income oil exporters. In 2018, the OECD countries together accounted for 17.2 percent of the world population and 36.6 percent of the world carbon dioxide emissions. The United States alone accounted for 41.5 percent of the total emissions by OECD countries or 15.2 percent of the world total emissions.
This leaves the rest of the world that accounted for 64.5 percent of the world population and 35.6 percent of the world carbon dioxide emissions in 2018. Note the interesting fact that the rest of the world’s share of world emissions is almost exactly the same as the combined share of China and OECD countries in the world population and the rest of the world’s share of world population is almost exactly the same as the combined share of China and OECD countries in the world carbon dioxide emissions. In an earlier study on emissions budget, Peters, Andrew, Solomon, and Friedlingstein (2015) proposed two politically plausible principles to divide up the global emissions budget between countries: the inertia principle and the equity principle. Under the inertia principle, each country is entitled to a share of the global emissions budget that equals its current share in global emissions.
Under the equity principle, each county is entitled to a share of the global emissions budget that equals its current share in global population. The inertia principle favors the “developed” capitalist countries as well as some large carbon dioxide emitters (such as China). By comparison, the equity principle is more favorable for the “developing” countries. In this paper, “developed” capitalist countries can be represented by the OECD countries and “developing” countries can be represented by “the rest of the world.” While other proposals to divide up the global emissions budget are conceivable, any politically plausible scheme for global emissions distribution is likely to fall within the range defined by the inertia principle and the equity principle. As is to be explained below, it is highly unlikely for the rest of the world to find the inertia principle acceptable. Thus, any proposal that divides the global emissions budget in a way that is more favorable for the developed capitalist countries than is proposed by the inertia principle will almost certainly be rejected by the rest of the world. Similarly, it is highly unlikely for the OECD countries to find the equity principle acceptable. Thus, any proposal that divides the global emissions budget in a way that is more favorable for the developing countries than is proposed by the equity principle will almost certainly be rejected by the developed capitalist countries.
As is explained in the previous section, the global emissions budget consistent with global warming by less than 2 degrees Celsius by the end of this century is calculated to be 1.41 trillion metric tons of cumulative carbon dioxide emissions during 2019-2100. Under the inertia principle, China, OECD, and the rest of the world would receive 27.8 percent, 36.6 percent, and 35.6 percent of this budget respectively (based on their share in world carbon dioxide emissions in 2018). China would be entitled to a total emissions budget of 392 billion metric tons, the OECD countries would be entitled to a total emissions budget of 516 billion metric tons, and the rest of the world would be entitled to a total emissions budget of 502 billion metric tons. Each of the three regions would be assigned a budget that is about 42 time of its emissions in 2018.
Under the equity principle, China, OECD, and the rest of the world would receive 18.3 percent, 17.2 percent, and 64.5 percent of the global emissions budget respectively (based on their share in world population in 2018). China would be entitled to a total emissions budget of 258 billion metric tons (about 27 times of China’s emissions in 2018), the OECD countries would be entitled to a total emissions budget of 243 billion metric tons (about 20 times of the OECD countries’ emissions in 2018), and the rest of the world would be entitled to a total emissions budget of 909 billion metric tons (about 75 times of the rest of the world’s emissions in 2018).
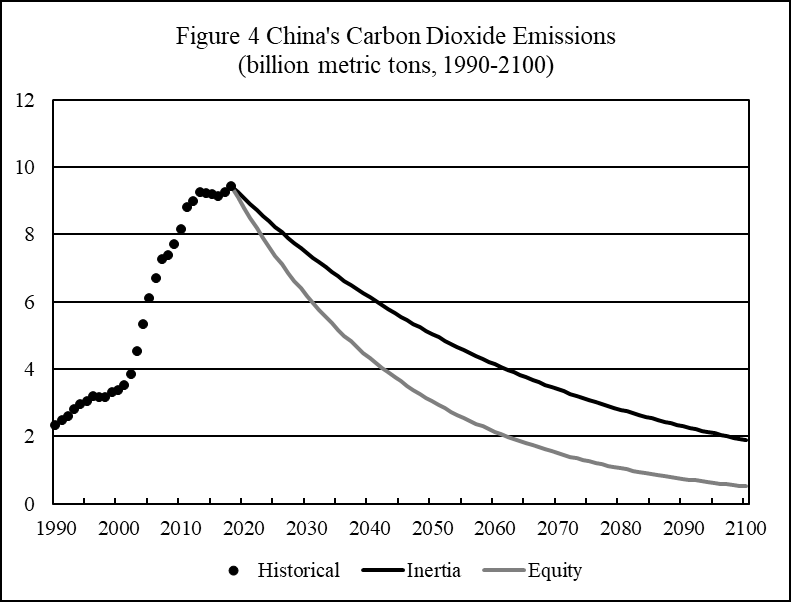
Sources: China’s historical carbon dioxide emissions are from BP (2019).
From 1990 to 2018, China’s GDP grew at an average annual rate of 9.61 percent and China’s carbon dioxide emissions grew at an average annual rate of 5.12 percent. It follows that China’s emissions intensity of GDP declined at an average annual rate of 4.1 percent (on the relationship between economic growth rate, emissions growth rate, and emissions intensity of GDP decline rate, see approximate equation 3 in the previous section).
Under the inertia principle, China’s carbon dioxide emissions should begin to decline in 2019 and decline at a uniform annual rate of 1.85 percent in order to stay within China’s emissions budget of 392 billion metric tons; by 2050, China’s emissions should fall by 45 percent from the 2018 level and by 2100, China’s emissions should fall by 78 percent. Under the equity principle, China’s carbon dioxide emissions should begin to decline in 2019 and decline at a uniform annual rate of 3.31 percent in order to stay within China’s emissions budget of 258 billion metric tons; by 2050, China’s emissions should fall by 66 percent from the 2018 level and by 2100, China’s emissions should fall by 94 percent.
If China were to maintain its historical decline rate of emissions intensity of GDP (4.1 percent), then the economic growth rate consistent with the inertia principle would be 2.17 percent and the economic growth rate consistent with the equity principle would be 0.65 percent (on the relationship between economic growth rate, emissions intensity of GDP decline rate, and emissions decline rate, see approximate equation 4 in the previous section). If China delays emissions reduction for a few more years, it is highly likely that the economic growth rate consistent with China’s emissions budget under the equity principle would be turned into negative.
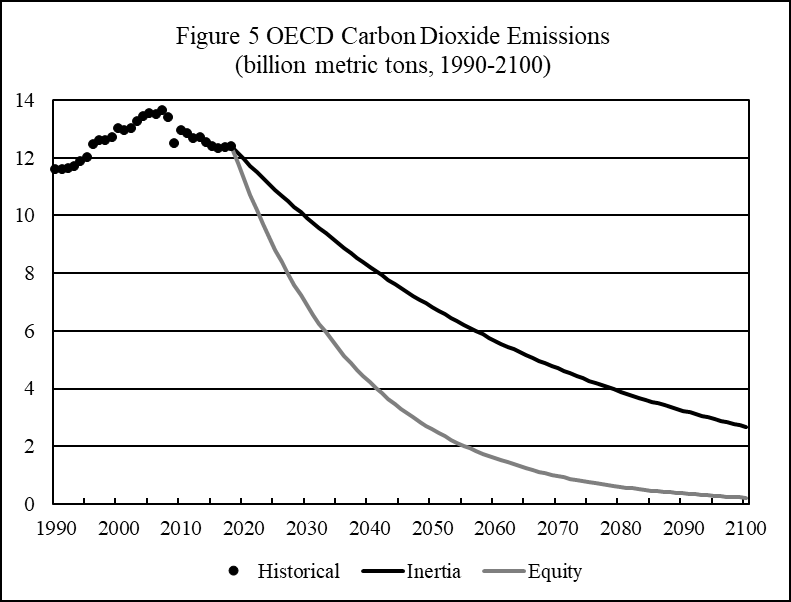
Sources: OECD countries’ historical carbon dioxide emissions are from BP (2019).
OECD’s total emissions peaked at 13.63 billion metric tons in 2007 and declined to 12.31 billion metric tons in 2016. In 2018, OECD’s total emissions recovered to 12.41 billion metric tons. From 1990 to 2018, OECD’s total GDP grew at an average annual rate of 2.16 percent and OECD’s total carbon dioxide emissions grew at an average annual rate of 0.24 percent. It follows that OECD’s emissions intensity of GDP declined at an average annual rate of 1.88 percent.
Under the inertia principle, OECD’s carbon dioxide emissions should begin to decline in 2019 and decline at a uniform annual rate of 1.85 percent in order to stay within OECD’s emissions budget of 516 billion metric tons; by 2050, OECD’s total emissions should fall by 45 percent from the 2018 level and by 2100, total emissions should fall by 78 percent. Under the equity principle, OECD’s carbon dioxide emissions should begin to decline in 2019 and decline at a uniform annual rate of 4.78 percent in order to stay within OECD’s emissions budget of 243 billion metric tons; by 2050, OECD’s total emissions should fall by 79 percent from the 2018 level and by 2100, total emissions should fall by 98 percent.
If the OECD countries were to maintain their historical decline rate of emissions intensity of GDP (1.88 percent), then the economic growth rate consistent with the inertia principle would be 0.03 percent. To be consistent with the equity principle, the OECD economies need to decline by 2.96 percent each year. As no capitalist country can survive permanent absolute economic decline, the equity principle would be absolutely unacceptable for the OECD countries. As the OECD countries currently have an average population growth rate of 0.56 percent, even the economic growth rate under the inertia principle would imply that the OECD’s average per capita GDP needs to decline by about 0.5 percent each year.
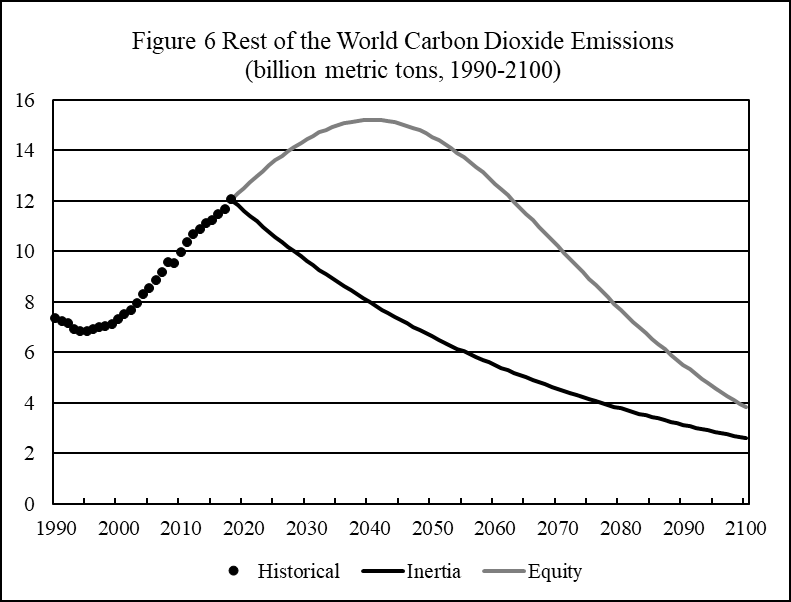
Sources: Rest of the world’s historical carbon dioxide emissions are from BP (2019).
From 1990 to 2018, the rest of the world’s total GDP grew at an average annual rate of 3.65 percent and the rest of the world’s total carbon dioxide emissions grew at an average annual rate of 1.78 percent. It follows that the rest of the world’s emissions intensity of GDP declined at an average annual rate of 1.8 percent.
Under the inertia principle, the rest of the world’s carbon dioxide emissions should begin to decline in 2019 and decline at a uniform annual rate of 1.85 percent in order to stay within the rest of the world’s emissions budget of 502 billion metric tons; by 2050, the rest of the world’s total emissions should fall by 45 percent from the 2018 level and by 2100, total emissions should fall by 78 percent. If the rest of the world were to maintain its historical decline rate of emissions intensity of GDP (1.8 percent), then the rest of the world’s total economic output needs to decline by 0.05 percent each year to be consistent with the inertia principle. As the rest of the world’s population continues to grow by 1.4 percent a year and many countries have population growth rates greater than 2 percent, the inertia principle would be absolutely unacceptable by the rest of the world.
There are a variety of conceivable emission pathways that can be made compatible with the rest of the world’s emissions budget under the equity principle. I assume that the rest of the world’s future emission pathway under the equity principle will follow a logistic curve, rising in the next two decades before declining at accelerating rates during the second half of the century. This approach allows the rest of the world to maintain economic growth rates similar to their recent growth rates in the next decade or so. Although the rest of the world’s total emissions still need to peak in 2040 and the emissions decline rate needs to gradually accelerate from 0.45 percent per year in 2041-2050 to 3.61 percent per year in 2091-2100. The above analysis makes it clear that neither the inertia principle nor the equity principle can be made compatible with continuing economic growth in all three regions. Only China can have positive economic growth under both the inertia principle and the equity principle (although the economic growth rate consistent with the equity principle is less than 1 percent). While the equity principle is absolutely unacceptable for the OECD countries, the inertia principle is absolutely unacceptable for the rest of the world. This analysis, of course, has not yet taken into account the difficulties that will arise when the emissions budget needs to be further distributed between individual countries of OECD and the rest of the world.
Technology Comes to the Rescue?
The last section assumes that, in the future, emissions intensity of GDP in China, OECD countries, and the rest of the world will decline at the same rates as their historical average rates. If the world is committed to rapid decarbonization and spend more resources on energy efficiency improvement and growth of renewable energies, it is conceivable that emissions intensity of GDP will decline at a more rapid pace. But by how much? Emissions intensity of GDP (the ratio of carbon dioxide emissions over GDP) can be decomposed into emissions intensity of energy (the ratio of carbon dioxide emissions to energy consumption) and energy intensity of GDP (the ratio of energy consumption to GDP): Emissions Intensity GDP = Emissions Intensity of Energy * Energy Intensity of GDP (5)
The above formula, in growth rate format, can be approximated as:
Emissions Intensity of GDP Growth Rate≈ Emissions Intensity of Energy Growth Rate + Energy Intensity of GDP Growth Rate (6)
Since the decline rate of a variable is the variable’s negative growth rate, therefore approximate equation (6) can be re-written as:
Emissions Intensity of GDP Decline Rate≈ Emissions Intensity of Energy Decline Rate + Energy Intensity of GDP Decline Rate (7)
Let us first consider the future potential of decline of energy intensity of GDP. Lightfoot and Green (2001) and Baski and Green (2007) calculated the long-term potential of world-wide energy efficiency improvement by estimating the physical limits to energy intensity decline within each economic sector and evaluating the impact of a range of plausible economic structural change. Under the most optimistic scenario they calculated, world average energy intensity of GDP is projected to fall by 77 percent from 1990 to 2100, implying an average annual decline rate of 1.34 percent.
From 1990 to 2018, world GDP (measured by purchasing power parity) grew at an average annual rate of 3.4 percent and world primary energy consumption grew at an average annual rate of 1.93 percent (BP 2019). It follows that the world average energy intensity of GDP declined at an average annual rate of 1.42 percent, slightly higher than the long-term decline rate estimated by Baski and Green (2007). However, if world GDP is measured by market exchange rate, the world’ average annual economic growth rate from 1990 to 2018 would be 2.81 percent (World Bank 2019) and the average annual decline rate of energy intensity of GDP would be 0.86 percent, significantly below the long-term decline rate estimated by Baski and Green (2007). Using the estimate made by Baski and Green, I assume that from 2018 to 2100, world average energy intensity of GDP will decline at an annual rate of 1.34 percent. By 2100, world average energy intensity will fall by 67 percent from the 2018 level. Now let us consider the future potential of decline of emissions intensity of energy. From 1990 to 2018, world average emissions intensity of energy declined at an average annual rate of 0.26 percent. By how much can the pace of decarbonization be accelerated in the future? The answer to this question depends, on the one hand, on how rapidly the share of fossil fuels (oil, natural gas, coal) in world energy consumption can be reduced in the future, and on the other hand, on what type of fossil fuels the world will use for the part of energy consumption that cannot be provided by nuclear or renewable energies.
In 1990, fossil fuels accounted for 88 percent of the world primary energy consumption. In 2018, fossil fuels still accounted for 84.7 percent of the world primary energy consumption, nuclear electricity accounted for 4.4 percent, hydro electricity accounted for 6.8 percent, wind and solar electricity accounted for 3 percent, and other renewable electricity accounted for 1 percent (BP 2019). With the exception of biofuels, all commercial nuclear and renewable energies are consumed in the form of electricity. Thus, the share of electricity in the world’s energy consumption will largely set the upper limit to the future expansion of nuclear and renewable energies. To compare electricity with primary energy consumption, electricity needs to be converted into primary energy using a formula known as “thermal equivalent” (that is, how much primary thermal energy it takes to produce a unit of electricity). The BP’s Statistical Review of World Energy assumes that one unit of electrical energy is equivalent to 2.632 units of thermal energy (equivalent to the assumption of 38 percent efficiency of a modern conventional thermal power plant) (BP 2019). Using this assumption, the world electricity generation’s thermal equivalent was 33.3 percent of world primary energy consumption in 1990 and 43.4 percent in 2018.
In the past, electrification of world energy has taken place in sectors that can be relatively easily electrified. In the future, further electrification may face serious economic and technical difficulties. In the transportation sector, although passenger transportation on roads may be electrified in the near future, there are major challenges that could prevent electrification of heavy trucks, airplanes, and ships. High-temperature industrial processes and the production of chemical inputs can be electrified in principle. But it has not yet been demonstrated that electrification in these areas can be made economically feasible (Heinberg 2015).
While world-wide electrification has proceeded steadily, electrification appears to have stalled in advanced capitalist countries in recent years. In the United States, the electricity share of primary energy consumption was 44.7 percent in 2010 and declined to 43.9 percent in 2018. In the European Union, the electricity share was 42.8 percent in 2010 and rose slowly to 44.0 percent in 2018. In Japan, the electricity share was 51.8 percent in 2010 and increased slightly to 52.4 percent in 2018 (calculated using data from BP 2019). Despite potential difficulties that may prevent steady progress of electrification in the future, I assume that world-wide electrification will continue to proceed according to its historical pace. From 1990 to 2018, the electricity share of world energy consumption increased at an average annual rate of 0.36 percentage points. If this rate is continued from 2018 to 2100, then by the end of this century, the electricity share of world energy consumption will rise to 72.9 percent.
How much of the future electricity generation will come from nuclear and renewable energies? In recent years, nuclear electricity has stagnated and the growth of renewable electricity is mainly led by wind and solar electricity. But wind and solar are intermittent sources of electric power. They cannot be effectively connected to electric grid without the backup of large-scale storage or fossil fuels. The current large-scale storage technology remains prohibitively expensive (Andrews 2018). In addition, wind and solar electricity has very large land requirements. According to Capellan-Perez, Castro, and Arto (2017), a transition to 100 percent solar energy may be physically unfeasible for most European countries and Japan as the land requirement of solar electricity exceeds all the available land in these countries.
In 2017, an intense debate took place among the world’s top energy experts. Jacobson et al. (2017) proposed a plan to transform the world’s energy infrastructure and build a new electric grid based on 100 percent renewable electricity. Clark et al. (2017) criticized the proposal by Jacobson et al. and argued that while an electricity system that is approximately 80 percent decarbonized may be built with reasonable cost, an electricity system with 100 percent renewable electricity faces formidable and perhaps insurmountable economic and technical difficulties. Goldman School of Public Policy of the University of California Berkeley recently proposed a plan to achieve 90 percent “clean” (carbon-free) electricity by 2035 in the United States (Goldman School of Public Policy 2020). Notwithstanding the controversies concerning the future potential of decarbonization in the electricity sector, it is obvious that 100 percent sets the maximum limit to the extent of decarbonization. I assume that, by 2100, all the world electricity generation will be provided by nuclear or renewable energies. Therefore, about 73 percent of the world energy consumption will be completely decarbonized (because electricity will account for about 73 percent of the world energy consumption by 2100). I further assume that the remaining 27 percent of the world energy consumption will be provided by natural gas, the cleanest type of fossil fuels. That is, oil and coal consumption will be completely eliminated.
In 2018, the world average emissions intensity of energy is 2.44 metric tons of carbon dioxide for each metric ton of oil equivalent (“oil equivalent” is a measure of energy consumption). Each metric ton of oil equivalent of natural gas emits 2.35 metric tons of carbon dioxide (BP 2018). Therefore, if 73 percent of the world’s energy consumption is completely decarbonized and the remaining 27 percent is provided by natural gas, the world’s expected emissions intensity of energy in 2100 can be calculated as: 73% * 0 + 27% * 2.35 = 0.63 metric tons of carbon dioxide for each metric ton of oil equivalent. Therefore, by 2100, the world average emissions intensity of energy is projected to fall by 74 percent from the 2018 level, implying an average annual decline rate of 1.63 percent.
Combining the projected decline rate of energy intensity of GDP (1.34 percent) and the decline rate of emissions intensity of energy (1.63 percent), the world average emissions intensity of GDP will decline at an average annual rate of 2.95 percent from 2018 to 2100 (see approximate equation 7 above). In 2018, the world average emissions intensity of GDP is 0.28 kilograms of emissions per dollar of GDP (world GDP is measured in constant 2011 international dollars). Based on the above assumptions, by 2100 the world average emissions intensity of GDP will fall to 0.024 kilograms of emissions per dollar of GDP or decline by 91.4 percent from the 2018 level. What will happen to the regional emissions intensity of GDP? In 2018, China’s emissions intensity of GDP was 0.418 kilograms per dollar of GDP, the OECD average emissions intensity of GDP was 0.241 kilograms per dollar of GDP, and the rest of the world’s average emissions intensity of GDP was 0.264 kilograms per dollar of GDP. It seems reasonable to assume that the region currently having higher emissions intensity will have more opportunities of technological catch-up and will experience more rapid decline of emissions intensity in the future.
Assuming that the three regions’ emissions intensity of GDP will gradually converge in the future and all regions will have the same emissions intensity of GDP as the world average by 2100, it can be calculated that China’s emissions intensity of GDP will fall by 94.3 percent from 2018 to 2100 (implying an average annual decline rate of 3.43 percent), the OECD average emissions intensity of GDP will fall by 90 percent (implying an average annual decline rate of 2.77 percent), and the rest of the world’s average emissions intensity of GDP will fall by 90.9 percent (implying an average annual decline rate of 2.88 percent). Under the inertia principle, the three regions’ total carbon dioxide emissions should decline by 1.85 percent each year from 2018 to 2100. Using the new decline rates of emissions intensity of GDP calculated above, China’s economic growth rate consistent with the inertia principle would be 1.64 percent, OECD’s economic growth rate consistent with the inertia principle would be 0.95 percent, and the rest of the world’s economic growth rate consistent with the inertia principle would be 1.06 percent (for the relationship between economic growth rate, emissions intensity of GDP decline rate, and emissions decline rate, see the approximate equation 4 in the section on “Global Emissions Budget”). With its population growth rate being 1.4 percent, the rest of the world would still suffer from absolute decline of per capita GDP. The OECD countries’ per capita GDP growth rate would be barely positive.
Under the equity principle, China’s carbon dioxide emissions should decline by 3.31 percent each year and the OECD total emissions should decline by 4.78 percent each year from 2018 to 2100. Using the new decline rates of emissions intensity of GDP, the Chinese economic growth rate consistent with the equity principle would be only 0.12 percent (virtually zero growth) and the OECD economies would have to decline by 2.07 percent each year to be consistent with the equity principle.
Structural Crisis of Capitalism and The Imperative for De-Growth
According to Immanuel Wallerstein, all historical systems have “lives” and capitalism is not an exception (Wallerstein 2007: 76). A historical system operates through various cyclical rhythms that help the system to self-adjust and restore equilibrium. In the capitalist world system, the cyclical rhythms have taken the form of short-term business cycles, half-a-century-long Kondratieff long waves, and multi-century hegemonic cycles. Giovanni Arrighi referred to the last type of cycles as “systemic cycles of accumulation” (Arrighi 1994).
However, each cyclical adjustment results in certain change in the system’s underlying parameters that have generated secular trends. As these secular trends approach their respective asymptotes, the system encounters problems it can no longer resolve within its own framework and the system enters into its structural crisis. The system then bifurcates, opening up the historical space for alternative solutions to the crisis. Wallerstein argued that, because of the secular trends of rising labor cost, environmental cost, and taxation cost, the capitalist world system had entered into its own structural crisis (Wallerstein 2003: 45-68; 2007: 76-90). Using Wallerstein’s concept of “structural crisis of the capitalist world system,” the current trend towards rising greenhouse gas emissions and global warming can be understood as one of the secular trends generated by the underlying laws of motion of the capitalist world system. As a system driven by the pursuit of “endless accumulation of capital,” it produces exponential growth of material production and consumption which in turn requires rising levels of energy consumption. The growth of energy consumption has historically taken the form of rising consumption of fossil fuels with its environmental impact overwhelming the absorptive capacity of the earth’s ecological systems. The previous sections of this paper have argued that the secular trend of global warming has created a crisis of human civilization that can no longer be resolved within the existing framework of the current world system.
According to Wallerstein, during the time of structural crisis, the future of the world is inherently uncertain. We are currently in a global struggle that could lead to either a highly unequal, hierarchical, post-capitalist system or a relatively egalitarian and democratic system (Wallerstein 2007: 89). Assuming that the global struggle in the coming decades can create the necessary political conditions for a global collective effort to achieve reasonable climate stabilization (that is, to limit global warming by the end of this century to not more than 2 degrees Celsius), what strategies should be taken for climate stabilization to be achieved? Obviously, society should mobilize its available resources to achieve decarbonization as rapidly as practically possible and reduce the emissions intensity of GDP at the maximum possible pace. However, unless the economic logic of capitalism is fundamentally transformed, any reduction of emissions intensity of GDP could be largely or even more than offset by economic growth.
The previous sections have established that both the OECD countries and the rest of the world have to accept near zero growth under the inertia principle of global emissions budget distribution and both China and the OECD countries have to accept near zero or negative growth under the equity principle of global emissions budget distribution. Therefore, a necessary condition for global climate stabilization is for a large part of the world (especially China and the OECD countries that have been responsible for most of the carbon dioxide emissions) to accept either zero growth or negative growth. While this paper focuses on climate stabilization, there has been a growing literature on “de-growth” arguing that zero or negative economic growth is a necessary condition not only for climate stabilization but also for ecological sustainability in general (Alier 2009; Hein and Rudelle 2020; Hickle and Kallis 2019; Kallis 2019; Kallis and March 2015; Schor and Jorgensen 2019; Van den Bergh and Kallis 2012). But how can the economic system be restructured to accommodate the demand for zero or negative growth?
To begin with, can the existing capitalist economic system be reformed to be made compatible with the requirements of climate stabilization? The previous sections have already argued that it is highly unlikely that a purely technical solution in the form of rapid reduction of emissions intensity of GDP would be sufficient so long as the capitalist economies continue to pursue positive economic growth. Capitalism is a historical system which distinguishes itself through its tendency towards “endless accumulation of capital.” This tendency derives, on the one hand, from the competition between multiple states in the world system, and on the other hand, from the dominance of market relations within each capitalist economy. While markets have existed through the entire history of human civilization, only capitalism has been characterized by the dominance of “production of commodities” (Marx [1893] 1967: 33). So long as an economy is based on the dominance of market relations, the pressure of market competition would constantly force capitalists to use a large portion of the surplus value at their disposal to accumulate capital and capital accumulation in turn leads to economic growth. Moreover, according to the world system approach, interstate competition forces each state within the capitalist world system to promote capitalist accumulation, reinforcing the system’s overall tendency towards endless accumulation.
In the unlikely event, even if the capitalist state somehow decides to be committed to de-growth and succeeds in limiting economic growth to zero or negative in the capitalist context, it would generate other undesirable consequences. The capitalists may respond to the disappearing of growth opportunities by capital flight or “investment strike” (cessation of not only new investment but also replacement investment needed to maintain existing capital), creating a massive economic crisis. Moreover, if labor productivity continues to rise in a zero-growth capitalist economy, unemployment will keep rising relentlessly creating a socially unsustainable situation (Magdoff and Foster 2011). If capitalism cannot be made compatible with climate stabilization to the extent this requires zero or negative economic growth, can some form of market socialism help to succeed where capitalism has failed?
Historical examples of “market socialism” such as the experiment of “workers’ self-management” in Yugoslavia or the Chinese “socialist market economy” have not provided encouraging evidence. These historical precedents demonstrate that “market socialism” is likely to be inherently unstable. Whatever is the initial structure in a market socialist economy, market competition inevitably generates tendencies towards inequality and concentration of wealth in the hands of a new capitalist class. For the purpose of this paper, it is sufficient to point out that so long as the market is the dominant mechanism of exchange and distribution, it will impose constant pressure on business enterprises (whether these are privately owned, publicly owned, or collectively owned) to accumulate capital and to expand as rapidly as possible. The market works because it rewards the commodity owners that produce more or better at lower cost with higher money income. Therefore, in an economy dominated by market relations, commodity owners are inevitably motivated to use the difference between their revenue and cost (whether you call it “profit” or “surplus value” or not) to either expand production or develop better technologies (that will lead to more production for a given level of inputs). If some commodity owners successfully expand their production and lower their costs (lower costs often help commodity owners to capture a bigger share of market and stimulate more expansion), those who fail to do so will be threatened by lower money income, bankruptcy, or complete elimination by competition. Therefore, eventually, most (if not all) commodity owners will be under constant and intense pressure to pursue capital accumulation and production expansion. This is perhaps one area where neoclassical economists, Marxist political economists, and world system theorists can all agree. Therefore, even if in the unlikely event, we can discover an economic system that is dominated by market relations but does not degenerate into capitalism, as far as capital accumulation and economic growth are concerned, it would still generate essentially the same dynamics as in capitalism.
The human beings have known only two types of institutional arrangement for the purpose of allocation of productive resources in an economy with large-scale division of labor. Society- wide allocation of productive resources can be done either through the market (based on trade or exchange between independent commodity owners) or “planning.” Here, planning refers to any institutional arrangement that allocates productive resources according to decisions made by a “political” institution and the term “political” is defined in its broad sense. To the extent that society-wide planning gives the society as a whole the power to allocate most (if not all) of the productive resources, it presupposes social ownership of the means of production. If an economic system based on the dominance of market relations is unlikely to deliver de-growth required for climate stabilization and ecological sustainability, this leaves the economic system based on society-wide planning as the only conceivable alternative. The conventional critique of the 20th century “socialist economies” based on centralized economic planning was that these economies were hopelessly inefficient because they could not rationally process the massive amount of information required for the operation of a modern economy and could not provide sufficient motivation to individuals without private property. The traditional critique of socialist inefficiency is probably exaggerated as the Soviet economy had outperformed most of the capitalist economies in economic growth for about half a century and the causes of economic stagnation in the 1970s and 1980s were complicated (Allen 2003).
But here the question is no longer about which economic system can most efficiently achieve economic growth. Instead, the question is about which economic system has the best chance to achieve climate stabilization under conditions of zero or negative growth. In this regard, an economic system based on social ownership of the means of production and society-wide planning has the unique advantage in that it allows the society as a whole to have overall control over the society’s surplus product. Therefore, if the necessary political conditions are created and the population is genuinely committed to the objective of climate stabilization (this is of course a big “if”), the society as a whole can use society-wide planning as the economic tool to allocate the surplus product for purposes other than capital accumulation (for example, the surplus product may be used for decarbonization, environmental cleaning, or projects that help to advance the general mental and physical potential of the population). An economic system based on social ownership of the means of production and society-wide planning does not have to mean the complete elimination of market. But it does require the market play a secondary or non-dominant role in the allocation of productive resources.
Conclusion
This paper evaluates the implications of global emissions budget distribution between three large geographical areas (China, OECD countries, and the rest of the world) in the context of Anthropocene and the structural crisis of the capitalist world system.
Under neither the inertia principle nor the equity principle, can continuing economic growth be made compatible with requirements of climate stabilization in all three regions. This conclusion does not change significantly when plausible acceleration of emissions intensity reduction in the future is taken into account. To limit global warming to not more than 2 degrees Celsius by the end of this century, at least two of the three large regions need to reorganize their economies to operate with zero or negative growth. Such a reorganization cannot be achieved under a capitalist economic system given the inherent tendency of capitalism towards endless accumulation. Neither is it likely to be achieved under any conceivable economic system dominated by market relations. By comparison, an economic system based on social ownership of the means of production and society-wide planning, may provide the society with the necessary economic tool to achieve de-growth and climate stabilization.
Society-wide planning, by itself, does not guarantee the success of climate stabilization. There are unresolved issues such as what type of world system may replace the capitalist world system. Capitalism has brought about a world system with multiple national states. This raises the question whether interstate competition may force the national states to pursue growth-oriented policy even in a post-capitalist world and how such competition may be eliminated or brought under control through alternative world-system arrangements. In his early works, Wallerstein (1979: 1-36) considered our current historical epoch to be in the transition from the capitalist world system to a future “socialist world-government.” Less promisingly, Arrighi (1994: 355-356) worried that the existing world system could be replaced by a “world-empire.” Although Arrighi also contemplated the possibility of a more egalitarian world “market economy,” de-growth was not a central theme in Arrighi’s writings. It is beyond the task of this paper to resolve these great questions that neither Wallerstein nor Arrighi resolved during their life time. I hope that the paper has at least demonstrated what cannot work for the purpose of climate stabilization and de-growth. Knowing what cannot work should help to limit the range of social experiment with which we want to engage in the future. It is in this sense that a system based on social ownership of the means of production and society-wide planning probably offers the best hope for the humanity.
About the Author: Minqi Li is a professor of economics at the University of Utah. He is the author of The Rise of China and the Demise of the Capitalist World Economy (Pluto 2009), China and the Twenty-first Century Crisis (Pluto 2015), and Profit, Accumulation and Crisis in Capitalism (Routledge 2020).
References
Alier, Joan Martinez. 2009. “Social Sustainable Economic De-growth.” Development and Change 40(6): 1099-1119.
Allen, Robert C. 2003. Farm to Factory: A Reinterpretation of the Soviet Industrial Revolution. Princeton and Oxford: Princeton University Press.
Andrews, Roger. 2018. “The Cost of Wind & Solar: Batteries Included.” Energy Matters, November 22, 2018. http://euanmearns.com/the-cost-of-wind-solar-power-batteries-included/#more-22760
Arrighi, Giovanni. 1994. The Long Twentieth Century: Money, Power, and the Origins of Our Times. London; New York: Verso.
Arrighi, Giovanni, Po-keung Hui, Ho-fung Hung, and Mark Selden. 2003. “Historical Capitalism, East and West.” Pp .259-333 in The Resurgence of East Asia: 50, 150 and 500 Year Perspectives, edited by Giovanni Arrighi, Takeshi Hamashita and Mark Selden. London and New York: Routledge.
Baski, Soham and Christopher Green. 2007. “Calculating Economy-Widen Energy Intensity Decline Rate: The Role of Sectoral Output and Energy Shares.” Energy Policy 35(2007): 6457-6466.
https://www.sciencedirect.com/science/article/pii/S0301421507003485.
Boden, Thomas A., Gregg Marland, and Robert J. Andres. 2017. “Global CO2 Emissions from Fossil-Fuel Burning, Cement Manufacture, and Gas Flaring, 1751-2014,” March 3, 2017. Carbon Dioxide Information Analysis Center, Oak Ridge National Laboratory, U.S. Department of Energy, Oak Ridge, Tennessee, USA. https://doi.org/10.3334/CDIAC/00001_V2017
BP. 2018. “Methodology for Calculating CO2 Emissions from Energy Use.” https://www.bp.com/content/dam/bp/business-sites/en/global/corporate/pdfs/energy-economics/statistical-review/bp-stats-review-2018-carbon-emissions-methodolgy.pdf
____2019. Statistical Review of World Energy 2019. http://www.bp.com/en/global/corporate/energy-economics/statistical-review-of-world-energy.html
Buttonwood, A Finance Column in The Economist. 2017. “What Is the OECD? What Does ‘a Club of Mostly Rich Countries’ Do?” The Economist, July 5, ____2017. https://www.economist.com/the-economist-explains/2017/07/05/what-is-the-oecd
Capellan-Perez, Inigo, Carlos de Castro, and Inaki Arto. 2017. “Assessing Vulnerabilities and Limits in the Transition to Renewable Energies: Land Requirements under 100% Solar Scenarios.” Renewable and Sustainable Energy Reviews 77(2017): 760-782. http://dx.doi.org/10.1016/j.rser.2017.03.137
Clark, Christopher T. M., Staffan A. Qvist, Jay Apt, Morgan Bazilian, Adam R. Brandt, Ken Caldeira, Steven J. Davis, Victor Diakov, Mark A. Handschy, Paul D. H. Hines, Paulina Jaramillo, Daniel M. Kammen, Jane C. S. Long, M. Granger Morgan, Adam Reed, Varun Sivaram, James Sweeney, George R. Tynan, David G. Victor, John P. Weyant, and Jay F. Whitacre. 2017. “Evaluation of a Proposal for Reliable Low-Cost Grid Power with 100% Wind, Water, and Solar.” Proceedings of the National Academy of Sciences of the United States of America. https://www.pnas.org/content/114/26/6722
Climate Actions Tracker. 2019. “Addressing Global Warming,” updated September 19, 2019. https://climateactiontracker.org/global/temperatures/
Davis, Christina L. 2016. “More Than Just a Rich Country Club: Membership Conditionality and Institutional Reform in the OECD.” Scholars at Harvard, June 26, 2016. https://scholar.harvard.edu/files/cldavis/files/davis2016b.pdf
EPI. Earth Policy Institute. 2015. “Climate, Energy, and Transportation,” Data Center, last updated April 2015. http://www.earth-policy.org/?/data_center/C23
Goldman School of Public Policy. 2020. The 2035 Report: Plummeting Solar, Wind, and Battery Costs Can Accelerate Our Clean Electricity Future. Goldman School of Public Policy, University of California Berkeley, June 2020. http://www.2035report.com/wp-content/uploads/2020/06/2035-Report.pdf?hsCtaTracking=8a85e9ea-4ed3-4ec0-b4c6-906934306ddb%7Cc68c2ac2-1db0-4d1c-82a1-65ef4daaf6c1
Hansen, James. 2007. Storms of My Grandchildren: The Truth about the Coming Climate Catastrophe and Our Last Chance to Save Humanity. New York; Berlin; London: Bloomsbury. 2019. “Updated Figures.” http://www.columbia.edu/~mhs119/UpdatedFigures/
Hansen, James and Maiko Sato. 2016. “A Better Graph,” September 26, 2016. http://www.columbia.edu/~jeh1/mailings/2016/20160926_BetterGraph.pdf
Hansen, James, Makiko Sato, Paul Hearty, Reto Ruedy, Maxwell Kelly, Valerie Masson-Delmotte, Garry Russel, George Tselioudis, Junji Cao, Eric Rignot, Isabella Velicogna, Evgeniya Kandiano, Karina von Schuckmann, Pushker Kharecha, Allegra N. Legrande, Michael Bauer, Kwak-Wai Lo. 2016. “Ice Melt, Sea Level Rise and Superstorms: Evidence from Paleoclimate Data, Climate Modeling, and Modern Observations that 2°C Global Warming Could Be Dangerous.” Atmospheric Chemistry and Physics 16: 3761-3812. https://doi.org/10.5194/acp-16-3761-2016
Hayek, Friedrich. [1948] 1996. Individualism and Economic Order. Chicago: University of Chicago Press.
Hein, Andreas M. and Jean-Baptiste Rudelle. 2020. “Energy Limits to the Gross Domestic Product on Earth.” arxiv.org:2005.05244 (a open access archive for scholar articles), May 11, 2020. https://arxiv.org/ftp/arxiv/papers/2005/2005.05244.pdf
Heinberg, Richard. 2015. “Renewable Energy Will Not Support Economic Growth,” Resilience, June 5, 2015. https://www.resilience.org/stories/2015-06-05/renewable-energy-will-not-support-economic-growth/
Hickel, Jason and Giorgos Kallis. 2019. “Is Green Growth Possible?” New Political Economy 25(4): 469-486.
IPCC. United Nations Intergovernmental Panel on Climate Change. 2013. Climate Change 2013: The Physical Science Basis. Contribution of Working Group I to the Fifth Assessment Report of the Intergovernmental Panel on Climate Change, Summary for Policy Makers. http://www.ipcc.ch/pdf/assessment report/ar5/wg1/WG1AR5_SPM_FINAL.pdf
______2014. Climate Change 2014: Mitigation of Climate Change. Contribution of Working Group III to the Fifth Assessment Report of the Intergovernmental Panel on Climate Change, Summary for Policy Makers. http://www.ipcc.ch/pdf/assessment-report/ar5/wg3/WG3AR5_SPM_FINAL.pdf
Jacobson, Mark Z., Mark A. Delucchi, Zach A. F. Bauer, Savannah C. Goodman, William E. Chapman, Mary A. Cameron, Cedric Bozonnat, Liat Chobadi, Hailey A. Clonts, Peter Enevoldsen, Jenny R. Erwin, Simone N. Fobi, Owen K. Goldstrom, Eleanor M. Hennessy, Jingyi Liu, Jonathan Lo, Clayton B. Meyer, Sean B. Morris, Kevin R. Moy, Patrick L. O’Neill, Ivalin Petkov, Stephanie Redfern, Robin Schucker, Michael A. Sontag, Jingfan Wang, Eric Weiner, and Alexander S. Yachanin. 2017. “100% Clean and Renewable Wind, Walter, and Sunlight All-Sector Energy Roadmaps for 139 Countries of the World.” Joule 1: 108-121. https://web.stanford.edu/group/efmh/jacobson/Articles/I/CountriesWWS.pdf
Jorgenson, Andrew K. and Brett Clark. 2012. “Are the Economy and the Environment Decoupling? A Comparative International Study, 1960-2005.” American Journal of Sociology 118(1): 1-44.
Kallis, Giorgos. 2019. “Socialism without Growth.” Capitalism Nature Socialism 30(2): 189-206.
Kallis, Giorgos and Hug March. 2015. “Imaginaries of Hope: the Utopianism of Degrowth.” Annals of the Association of American Geographers 105(2): 360-368.
Lightfoot, H. Douglas and Christopher Green. 2001. “Energy Intensity Decline Implications for Stabilization of Atmospheric CO2 Content.” Centre for Climate and Global Change Research Report 2001-7, McGill University, October 2001. http://citeseerx.ist.psu.edu/viewdoc/download?doi-10.1.1.194.4922&rep=rep1&type=pdf
Maddison, Angus. 2010. “Statistics on World Population, GDP, and Per Capita GDP, 1-2008 AD.” http://www.ggdc.net/MADDISON/oriindex.htm
Magdoff, Fred and John Bellamy Foster. 2011. What Every Environmentalist Needs to Know about Capitalism. New York: Monthly Review Press.
Marx, Karl. 1967[1867]. Capital, volume 1. New York: International Publishers. . 1967[1893]. Capital, volume 2. New York: International Publishers.
NASA. National Aeronautics and Space Administration, Goddard Institute for Space Studies. 2019. “GISS Surface Temperature Analysis.” https://data.giss.nasa.gov/gistemp/
NOAA. National Oceanic and Atmospheric Administration, US Department of Commerce. 2019a. “The NOAA Annual Greenhouse Gas Index.” https://www.esrl.noaa.gov/gmd/aggi/aggi.html
. 2019b. “Mauna Loa CO2 Annual Mean Data.” ftp://aftp.cmdl.noaa.gov/products/trends/co2/co2_annmean_mlo.txt
Noble, Chris. 2019. “OECD, Rich Nations Club, Proposes Global Tax Overhaul.” The Information, October 9, 2019. https://www.theinformation.com/briefings/e09303 OECD. Organisation for Economic Co-operation and Development. 2020. “Member Countries.” https://www.oecd.org/about/members-and-partners/
Peters, Glen P., Robbie M. Andrew, Susan Solomon, and Pierre Friedlingstein. 2015. “Measuring a Fair and Ambitious Climate Agreement Using Cumulative Emissions.” Environmental Research Letters 10(10): 105004-105012. doi:10.1088/1748-9326/10/10/105004.
Schor, Juliet B. and Andrew K. Jorgenson. 2019. “Is It Too Late for Growth”. Review of Radical Political Economics 51(2): 320-329.
Sherwood, Steven C. and Matthew Huber. 2010. “An Adaptability Limit to Climate Change due to Heat Stress.” Proceedings of the National Academy of Sciences 107(21): 9552-9555, May 25, 2010. https://doi.org/10.1073/pnas.0913352107
Shively, W. Philips. 2005. Power and Choice: An Introduction to Political Science, 9th edition. New York: McGraw-Hill. SQS. Subcommission on Quaternary Stratigraphy. 2019. “Results of Binding Vote by Anthropocene Working Group,” released on May 21, 2019. http://quaternary.stratigraphy.org/working-groups/anthropocene/
Spratt, David and Philip Sutton. 2008. Climate Code Red: The Case for A Sustainability Emergency. Fitzroy, Australia: Friends of the Earth.
Stiglitz, Joseph E. 1994. Whither Socialism? Cambridge, MA: The MIT Press.
Thomas, Julia Adeney. 2019. “Why the ‘Anthropocene’ Is Not ‘Climate Change’ and Why It Matters.” Asia Global Online, January 10, 2019. https://www.asiaglobalonline.hku.hk/anthropocene-climate-change/
Thombs, Ryan P. 2017. “The Paradoxical Relationship Between Renewable Energy and Economic Growth: A Cross-National Panel Study, 1990-2013.” Journal of World-Systems Research 23(2): 540-564.
UNFCCC. United Nations Framework Convention on Climate Change. 2019. “The Paris Agreement.” https://unfccc.int/process-and-meetings/the-paris-agreement/
Van den Bergh, Jeroen C. J. M. and Giorgos Kallis. 2012. “Growth, A-Growth or Degrowth to Stay within Planetary Boundaries?”. Journal of Economic Issues XLVI(4): 909-919.
Wallerstein, Immanuel. 1979. The Capitalist World Economy: Essays by Immanuel Wallerstein. Cambridge: Cambridge University Press.
_____2003. The Decline of American Power: The U.S. in a Chaotic World. New York; London: The New Press
______2007. World-Systems Analysis: An Introduction. Durham and London: Duke University Press.
Waters, Colin N., Jan Zalasiewicz, Colin Summerhayes, Anthony D. Barnosky, Clement Poirier, Angnieszka Galuszka, Alejandro Cearreta, Matt Edgeworth, Erle C. Ellis, Michael Ellis, Catherine Jeandel, Reinhold Leinfelder, J. R. McNeill, Daniel de B. Richter, Will Steffen, James Syvitski, Davor Vidas, Michael Wagreich, Mark Williams, An Zhisheng, Jacques Grinvald, Eric Odada, Naomi Oreskes, Alexander P. Wolfe. 2016. “The Anthropocene Is Functionally and Stratigraphically Distinct from the Holocene.” Science 351 (6269): aad2622, January 8, 2016. https://doi.org/10.1126/science.aad2622
Wolf, Richard D. 2012. Democracy at Work: A Cure for Capitalism. Chicago: Haymarket Books.
World Bank. 2019. World Development Indicators. https://databank.worldbank.org/data/source/world-development-indicators . 2020. “World Bank Country and Lending Groups.” https://datahelpdesk.worldbank.org/knowledgebase/articles/906519-world-bank-country-and-lending-groups

One thought on “Anthropocene, Emissions Budget, and the Structural Crisis of the Capitalist World System”